How to Use Google Analytics to… Improve Your Blog’s Content

Did you read our recent beginner’s guide to Google Analytics? We recommend you go have a peek now (unless you’re already using Google Analytics of course), because today we’re going to delve in deeper and show you how you can really use it to your advantage to create better blog posts that more people will read and share.
In that blog post we introduced you to three sections of Google Analytics, and today’s post is all about the Behaviour section. This is where you’ll find stats on how users are interacting with your blog, such as how many posts they’re reading and how long they’re sticking around.
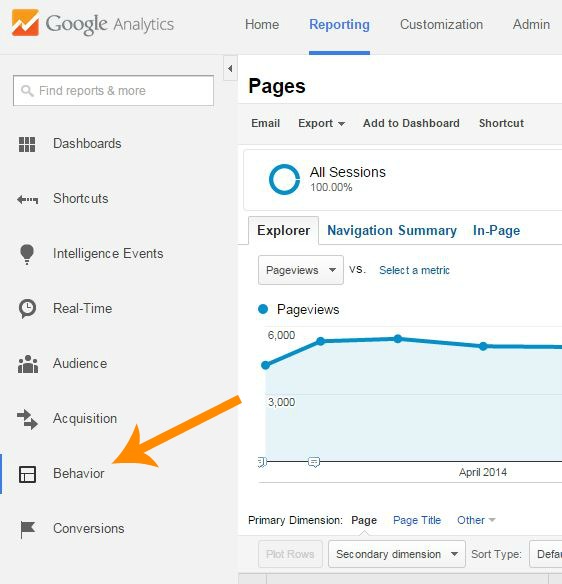
The Behaviour menu contains lots of really cool sub-sections, but as a newbie there’s only one you really need to know about, ‘Site Content’.
Click on Site Content > All Pages for a really interesting overview of what’s being looked at on your blog. You’ll see all your blog posts (and any pages you have, like your About page and blog homepage) ordered by how many page views they’ve had, so you can see at a glance which posts or pages on your site are getting lots of attention. At the top of this column is the total number of page views you’ve had over your whole site.
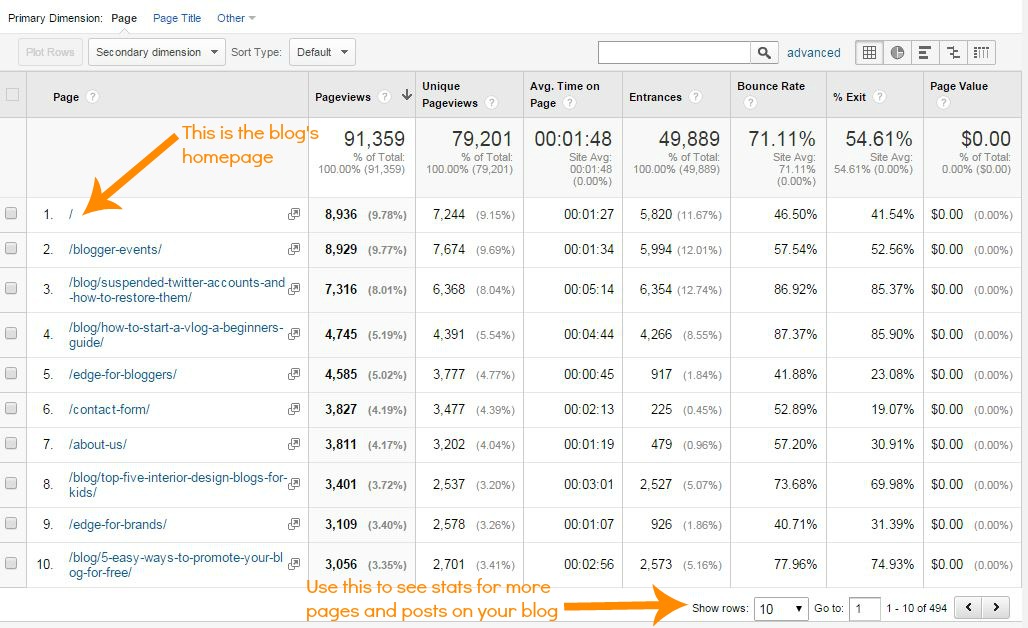
Remember that you can change the date range in the top, right-hand corner if you want to see stats for today, this week or since your blog began.
The Avg. Time on Page column shows, at the top, the average time someone spends on any one page of your blog. Below, you can see the average time spent on specific pages and posts. Click the column’s title to order from highest to lowest and you can see which posts people spend the longest time reading.
The Bounce Rate and % Exit columns show how many readers left your blog after checking out a specific post. Everyone who leaves your blog after looking at that page has ‘exited’ but they’ve only ‘bounced’ if that was the only page they looked at, without say scrolling through your homepage or reading another blog post first.
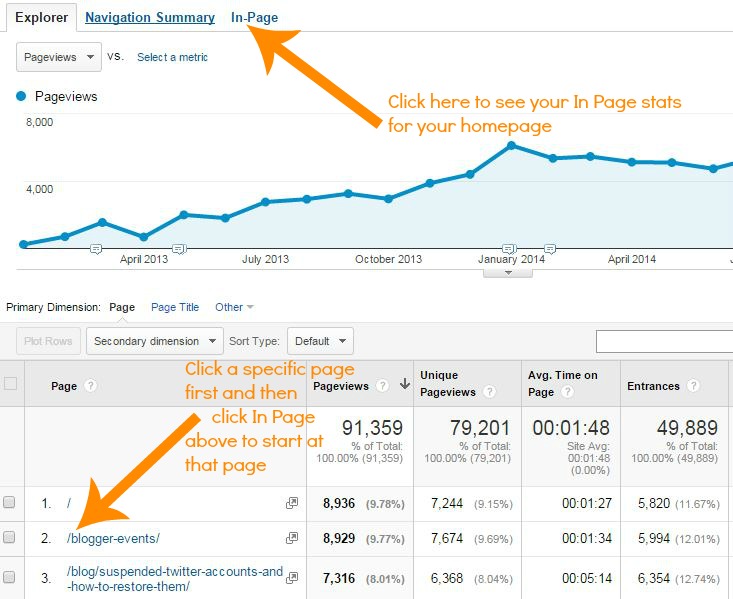
Want to see something awesome? Click on the In Page tab and Google Analytics will load your blog with some interesting stats laid over the top of it (if you’re using Chrome or Firefox you might need to click the shield icon in your address bar and allow insecure content for this to work properly).
You’ll see little bubbles with percentages all over your blog – these show what percentage of people who were on this page clicked on which links. Don’t worry – only you can see these bubbles, not your readers!
You can browse through your whole blog this way, so if you click through to a recent post you wrote you can see what people clicked on next after reading it.
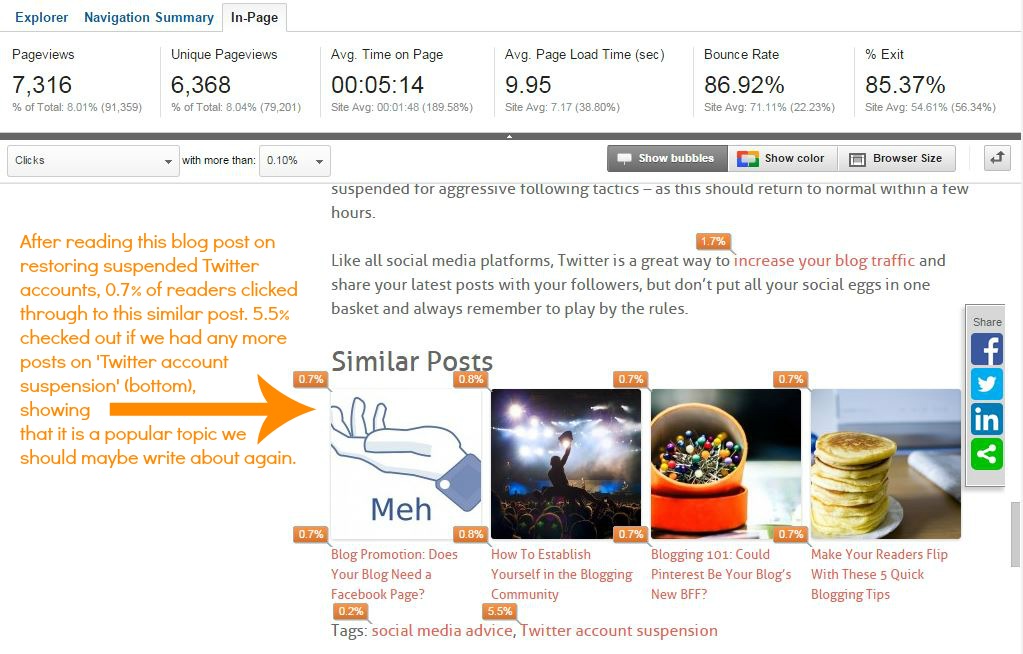
However unless you do some fancy HTML wizardry you’ll only see clicks to other pages on your blog, so if they clicked a link to one of your social media profiles or someone else’s website it won’t show up.
So, which posts do my readers love most?
Knowing which of your blog posts got the most comments is useful, but it’s not the whole story – maybe one of your best posts isn’t getting many comments simply because it’s so awesome it’s already answered any questions your readers might have had in the text.
Start by taking a look at which of your posts has received the most page views, as we showed you how to do above. If they have a lot more page views than unique page views, this means lots of people are coming back to this post more than once – which shows they must be finding it useful or interesting!
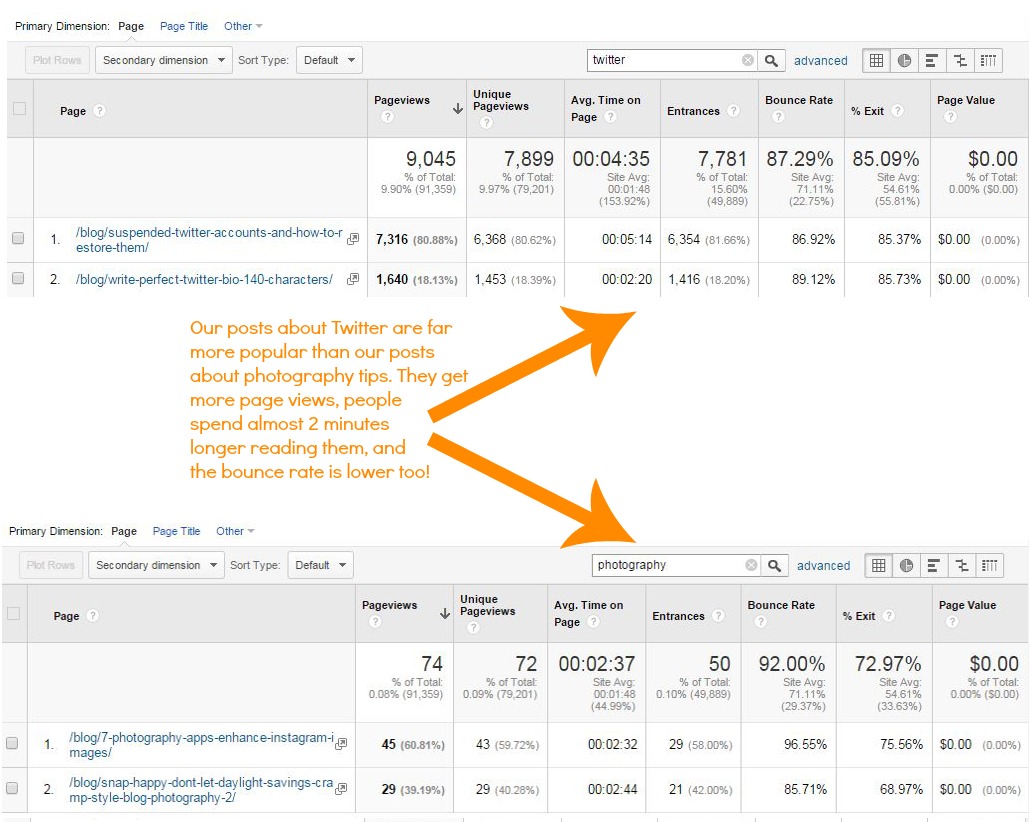
If your post titles or URLs tend to contain words that explain what they’re about (such as ‘review’ or ‘DIY’), you can also type these into the search box to see which topics or types of post are generally popular.
And which topics are they not so keen on?
If you’re blogging for long enough, eventually you’re going to write a post or two that just don’t get as much love and attention as your stuff usually does.
Aside from simply low page views, have a look at the average time spent on the page for specific posts or topics – if that’s low too it might mean your readers are just skimming through quickly rather than devouring every word, or are getting bored and clicking away before they finish the article.
Blog posts that have a high bounce rate or exit rate might also be ‘problem’ posts, since most of the people reading them haven’t found them interesting enough to want to click through to something else you’ve written.
How can I improve my blog’s content?
Simply put, by keeping an eye on which posts or topics are popular – and which aren’t – you can come up with an editorial calendar that includes more of what your readers love and less of what they don’t.
Google Analytics is also useful if you’re thinking of experimenting with a new topic, such as branching out from fashion to lifestyle, as you can test the waters with a few posts and then check if they are as popular as what you normally blog about.
We hope you’ve found this post useful, and don’t forget to subscribe over on the left so you don’t miss our next Google Analytics post where we’ll be telling you all about using it to increase your blog traffic!
Do you have any questions? Let us know in the comments below.


Leave a Reply