A Simple Guide to: Twitter Analytics

Checking out your social media analytics is a great way to track what’s working, what isn’t and how you could improve. Analytical tools can seem a little daunting if you don’t have an understanding of the complicated terminology or what all the stats mean, which is why in the past we’ve bought you our extensive series on Google Analytics for Bloggers and our guide to Pinterest Analytics. Now we’re here to show you the ins and outs of Twitter’s built-in analytics tool!
First Things First.
Before you start to analyse anything, obviously, you’ll need to know how to access your Twitter analytics profile. Head to https://analytics.twitter.com and click ‘turn analytics on’ to get started for the first time. Twitter only starts tracking your activity from this point, so you may need to wait a week or so before you can start digging around in the statistics.
After a short while, an analytics option will show up just above the log-out option on your desktop Twitter profile too.

Upon opening your analytics dashboard you’ll see an overview for the last 28 days, which includes stats on your Tweets, Tweet Impressions, Profile Visits, Mentions and Followers.

The little green and red arrows compare these to the previous period, which is useful to see if there’s been a drastic change. If you’ve been trying something new lately, such as tweeting more regularly, this gives you a quick overview of the impact it’s having.
Just beneath this you’ll see a broader view of your monthly ‘highlights’, including your top Tweet, top mention, top follower (the new follower with the largest following themselves) and top media Tweet (one with an image, video, poll or other media attached). Seeing a clear break down of this information can help you to understand the stats from the 28-day summary even better.

You can ask yourself why your top Tweet got so many impressions and how you can replicate that again, especially on Tweets to promote your newest content. Did you use a particular hashtag or an eye-catching image?
Make note of your top follower to see how you could engage with them more, they followed you for a reason after all!
Further down your dashboard you’ll see the same information for previous months, which is great for comparing and looking for trends. If your top tweet each month often includes a GIF for example, perhaps you should start to use them more.
Analyse Your Tweets
Clicking over to the ‘Tweets’ tab at the top will show you a more in depth look at exactly how those Tweets of yours are performing over time.

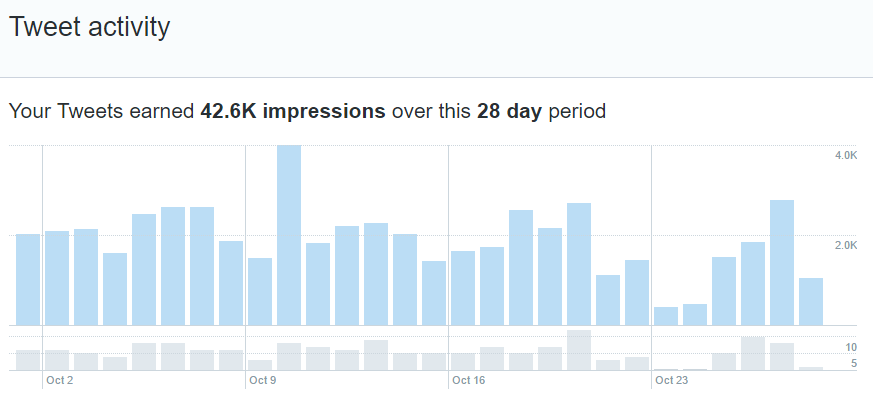
At the top of the page you’ll see a graph showing the daily impressions you got, which is how many times someone, somewhere saw one of your tweets. This is great for judging which day of the week works best for you, powerful information to have if you’ll be scheduling in your updates.
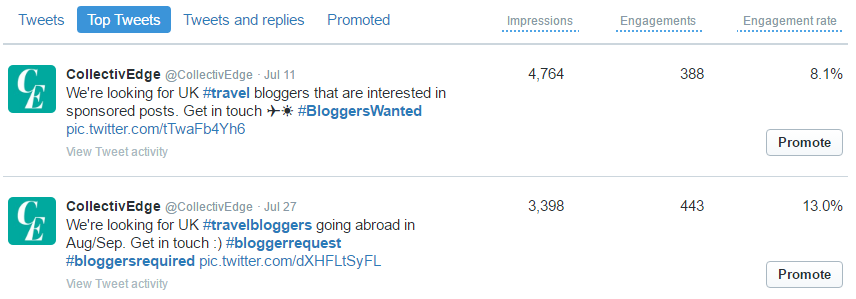
Below that you’ll get that in-depth knowledge about your Tweets, including Impressions, Engagement and Engagement Rate. ‘Engagements’ are things such as clicks, likes and replies.

Looking at your Impressions for a Tweet is a great way to see which hashtags or topics are getting the most eyeballs on them. It’s not all about views though so do check out the engagement columns – a niche hashtag might get your tweet seen by fewer people, but by people more interested in your content who are interacting with those tweets more.

Click ‘Top Tweets’ on this table to easily find which of your tweets have performed the best!
What Does Your Audience Want?
Going along to the third Audience tab is one of the best tabs for those of you who want to tap into your followers’ own interests, to alter your content towards them if need be.


At a glance, you’ll see the top-level information about your followers, their most common Interest, Demographic, Lifestyle, and Consumer Behaviour. Hey online luxury fashion shoppers following CollectivEdge!
Beneath this in each tab, you’ll find all sorts of further information on their interests, income level, gender, age… even what TV genres they watch! This is a great way to see if what you’re posting matches up with what your followers actually care about.
That’s all for our not-so-brief rundown of Twitter Analytics, and if this hasn’t convinced you to give it a try, we don’t know what will! We’re obsessed with this in-depth and, best of all, free tool for discovering your true Twitter audience.
Do you use Twitter Analytics? We’d love to hear what your favourite feature is, tell us in the comments below.


Leave a Reply