How to Use Google Analytics to… Determine Your Best Blog Posts

Earlier this year we brought you a series of introductory guides to Google Analytics for bloggers, and now we’re back for Round 2. This next series is aimed at bloggers who’ve already gotten to grips with the basics of Google Analytics and are ready to take their blog to the next level.
First up, we’re going to talk about determining your best blog posts, which we touched on in our guide to improving your blog’s content, and then how to make them even better.
Without Google Analytics, you’d probably gauge the success of your posts based on how many comments or social shares they get, but these aren’t the only signs of a popular post (and certain types of post, like giveaways, are likely to get the most comments and shares even if they aren’t your best writing).
So what are the signs of a great blog post?
1. Lots of Readers
Having lots of your blog traffic go to a specific post means that it’s an interesting (or controversial) topic, one that makes people want to take a look!
Perhaps it has a great title, or maybe someone found it interesting enough to share or link to elsewhere.
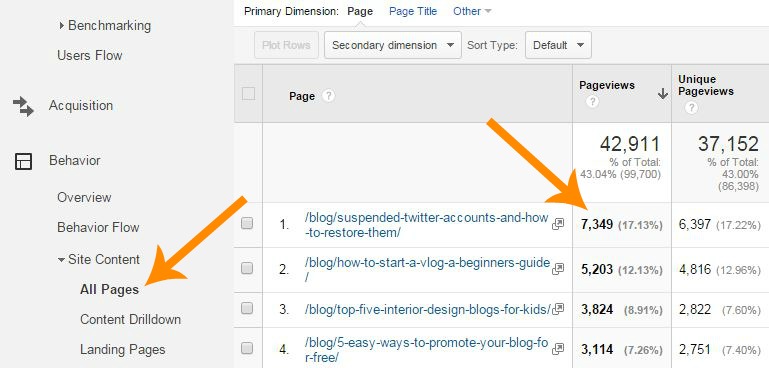
Go to Behaviour > Site Content > All Pages and set the date range based on what you’re interested in (your most popular posts this year, or since you started blogging, for example). Your posts will be sorted from highest to lowest pageviews.
Make it better…
Click on your most popular posts in Google Analytics and check out the graph at the top, which will show you how those pageviews have been spread across time. Perhaps you’ve had a steady flow of readers to the article since you published it, which is great.
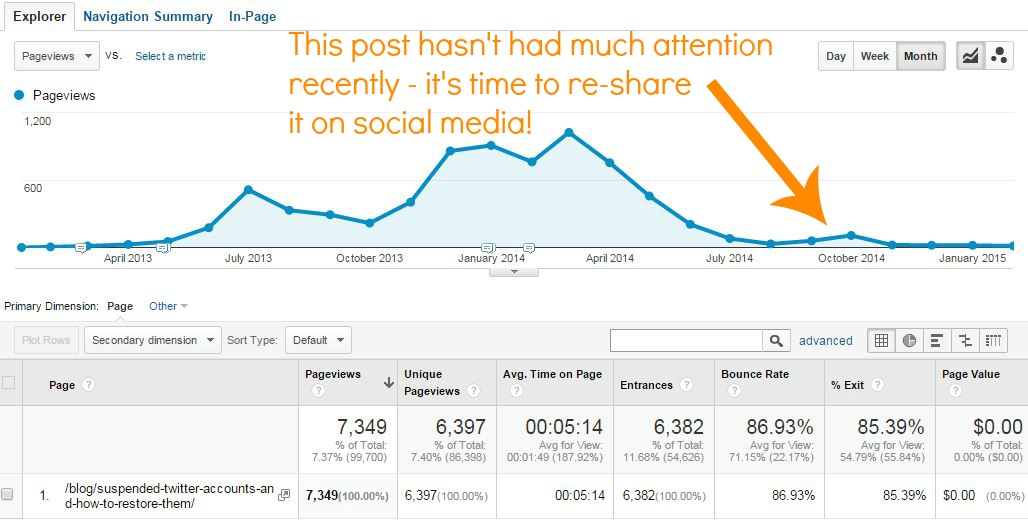
If however you had tons of readers when it went live and now it has tailed off, it’s time to do a #TBT and promote that post on social media all over again! You might also want to add it to a ‘popular posts’ list in your sidebar or footer so it’s visible and tempting to your readers all year round.
2. Readers that Actually Read
Okay, so far so good, but having lots of readers isn’t the most important statistic you should be checking. What would you rather have, ten visitors who read through to the end of the post, or a hundred who click onto the page but decide it’s not for them, and leave? Which are more likely to come back for more or become a subscriber?
Going back to Behaviour > Site Content > All Pages, you can see how long the average visitor spends on each article you’ve written by clicking Avg. Time on Page to sort from high to low.
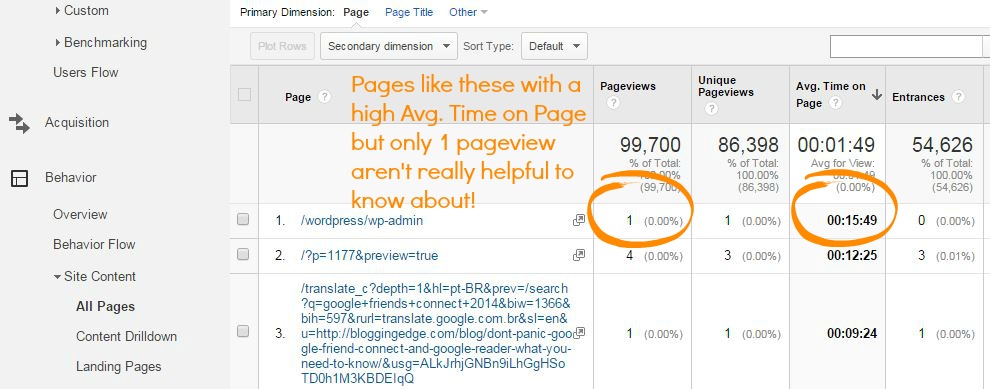
To get more accurate statistics you want to look at posts that have had at least a few views, since 1 person spending 5 minutes on the article you published 10 minutes ago doesn’t necessarily indicate that everyone else will spend that long reading it too.
At the top of the table, click advanced, and then set the filter that appears to Include : Site Usage > Pageviews : Greater than : 50. This will only show the average time-on-page for posts with 50 or more pageviews. You can of course change the number 50 if your blog has a particularly small or large readership.
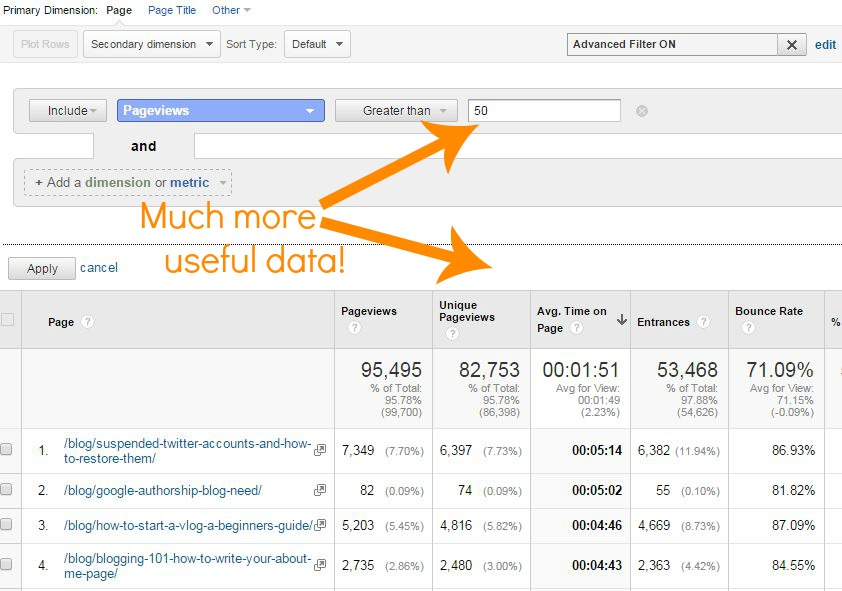
A post that lots of people spend a long time looking at is a sign that you’ve written something genuinely interesting, helpful or otherwise wonderful and good.
Make it better…
As before, it’s time to re-promote all of your blog posts that have a high time-on-page to drive some more traffic their way.
It’s also worth taking the time to look back at these posts and work out what makes them so engaging. Are they longer than usual? Do they have more pictures, or help your readers in some way such as a clear ‘how to’ post?
Work out what it is that’s making these posts stand out to your readers, and do more of it.
3. Readers that Stick Around
Even better than a blog visitor who spends time reading one of your posts is a blog visitor who spends time reading lots of your posts!
Your blog posts that make readers click through to other parts of your site are clearly awesome because they’re making the people reading them want to stick around and check out some more of what you’ve written.
Again, start at Behaviour > Site Content > All Pages and this time click on % Exit twice to sort from lowest to highest. Set the filter to only show statistics for posts with lots of views, as we explained how to do above.
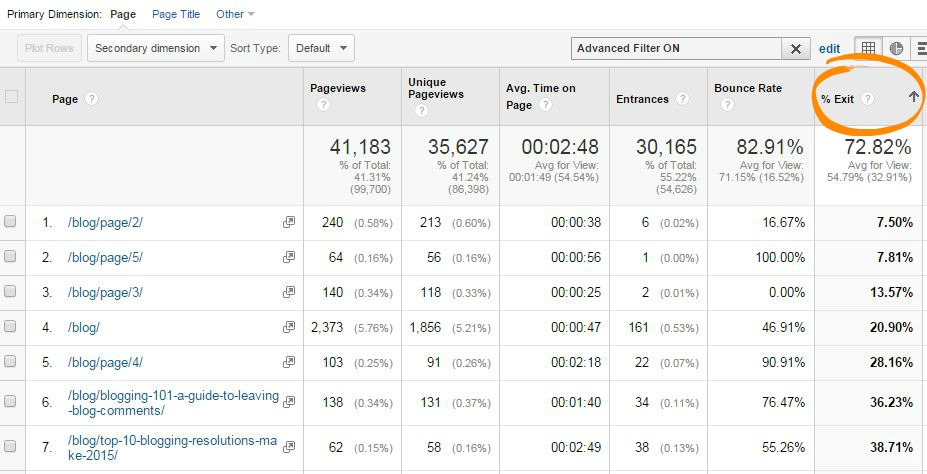
A low exit rate is good – it means a high proportion of your readers didn’t close the tab or go to another website after checking out this page.
Make it better…
Once you know which of your blog posts have the lowest exit rates, you can promote them as before. To really make a difference to the average exit rate of your blog articles though, you want to focus on the posts with a high exit rate.
When your readers get to the end of these posts, there’s nothing tempting them to go anywhere else on your site. A really easy, effective fix is to add links to similar posts at the bottom of the article – WordPress has some great plugins to do this automatically.
Don’t forget to take a look at your blog’s footer too. This is the last thing readers will see when they scroll to the end of a post, so make sure it’s not boring (or worse, empty!). Perhaps you could include links to other posts here, such as a ‘featured post’ widget, or have links to your blog categories.
By all means link to things like your social media pages – there’s nothing wrong with this – but remember that to decrease your blog’s exit rate you want to entice people to click on more things within your blog site too.
We hope you’ve found this article useful, and we’ll be back soon with some Google Analytics secrets to improve your blog design!
Have any questions? Leave a comment below.


Leave a Reply